Chrome inspector tips and tricks
Last updated on May 2022
Here are some features, tips and tricks for using Chrome's inspector. It is very powerful with lots of advanced tooling to help with developing FE web applications, but I think most of the features go unused because they're not very clear or hidden away.
Hopefully this is useful and someone learns something from it.
Live expressions
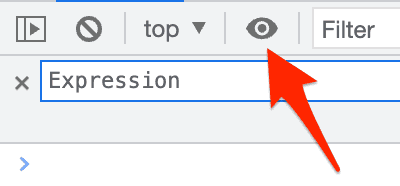
Ever wondered what the eye icon is? It is for live expressions. I spent what feels like years seeing it and not understanding what it was for, but its pretty handy sometimes.
Type in something e.g. window.activeElement, and it will show the value for it (even if it changes)
Activate it by pressing the eye icon:
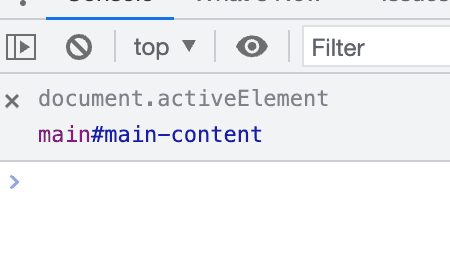
Then type something in to monitor, e.g. document.activeElement, and as you click around and change the active element it will update.
You can also enter things like Date.now() which will continuously update, or a function, or statement.
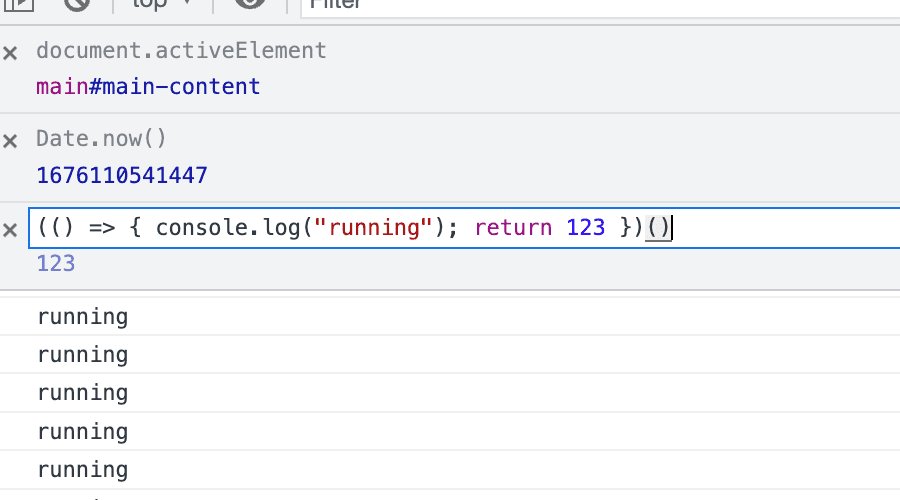
(note: i wrapped it in a function, but it isn't needed)
On my machine it seems to update around every 300ms
Copy all CSS changes after editing in the inspector
If you make changes to CSS in Chrome, sometimes you might want to copy it over to your code. Luckily Chrome has a feature that shows all the changes (per file) that you can use to copy/paste.
In the elements tab, bring up the console (press escape key), and click the 'changes' tab:
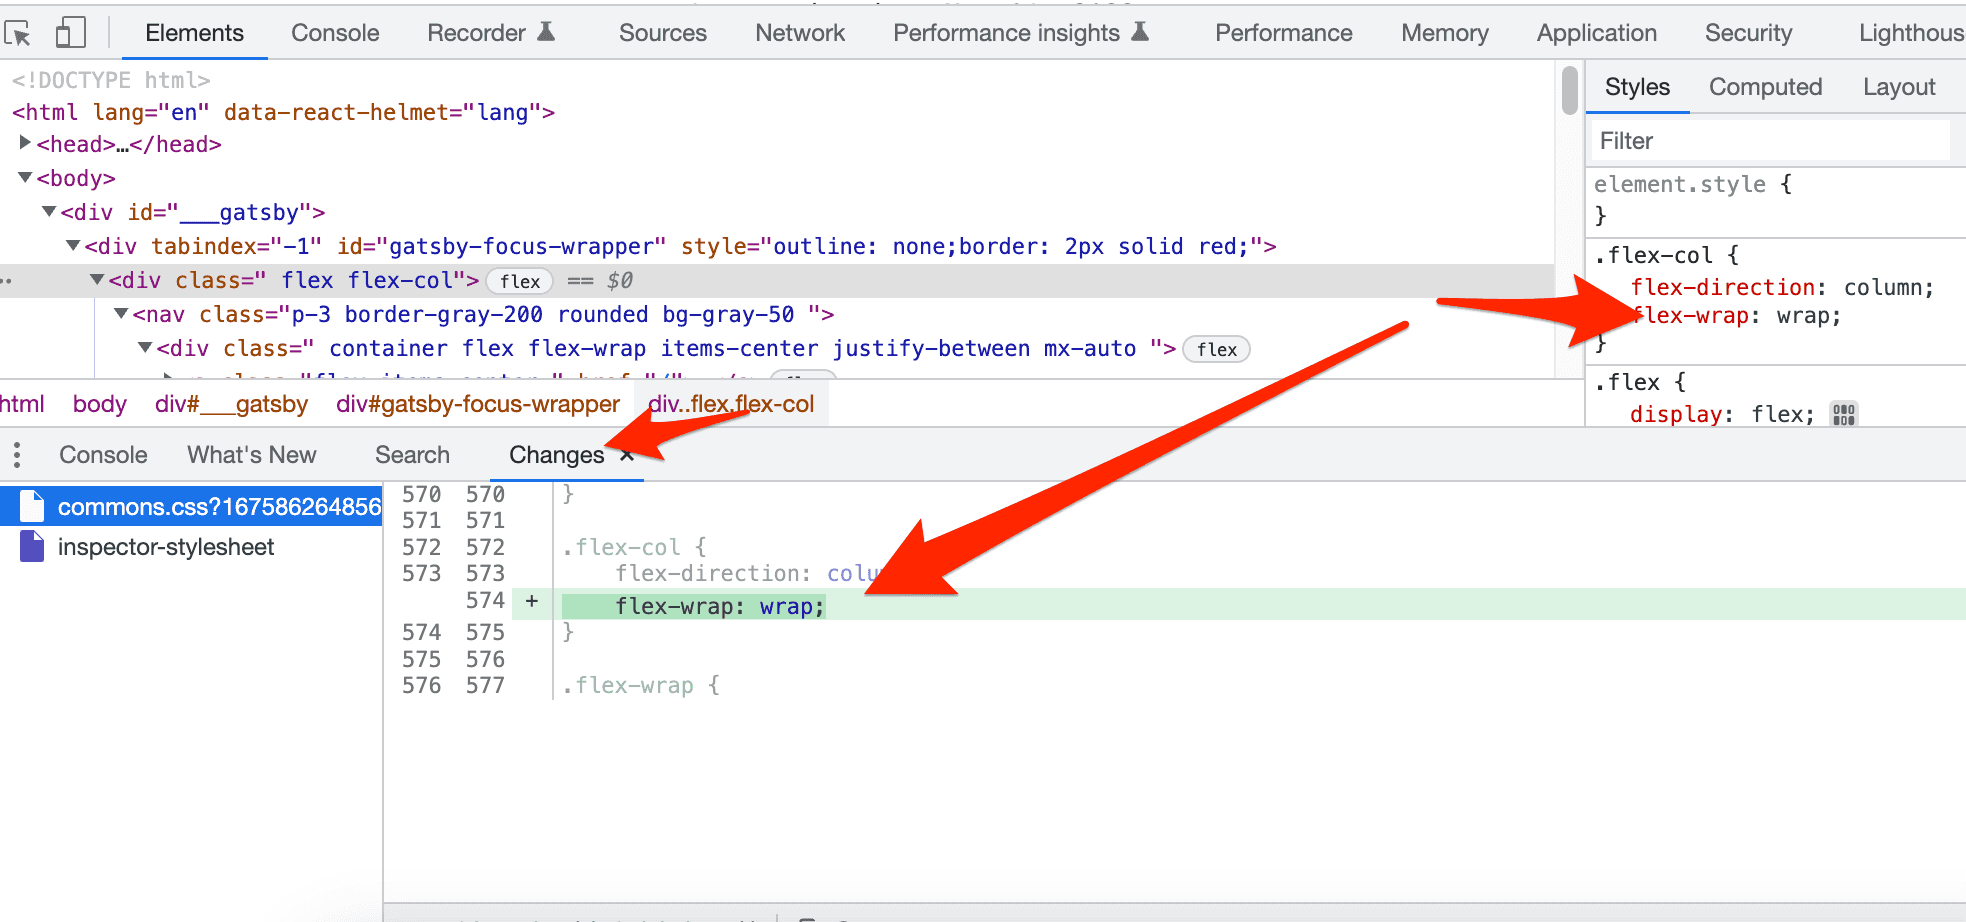
It shows a list of css files, and whos which changes you made. In the screenshot I changed .flex-col to have flex-wrap: wrap, and it shows up. You can then copy/paste it.
This is useful when making changes in the browser, and once it looks as you want you then copy it over to your IDE.
Note: you can edit source files directly in Chrome (but I've never found a nice flow to do this with real React apps. Looks great in demos when working with plain HTML/CSS files though).
console.table()
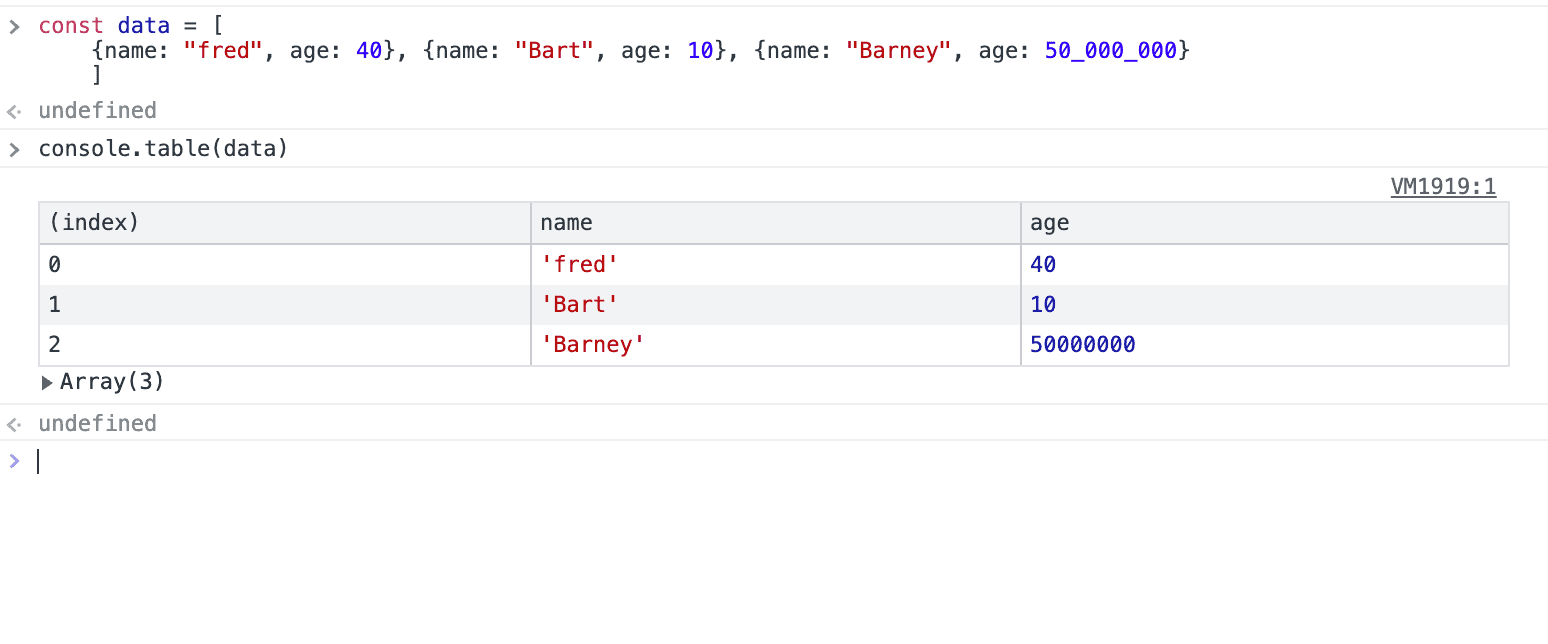
I think this is a commonly used / known tip, but I find the console.table() very useful when looking at variables in the console (especially with the debugger).
It outputs arrays of objects in a nice table.
Right click on refresh page to see more options
If you have the dev tools inspector open, right click on the reload button and you get a couple of extra options
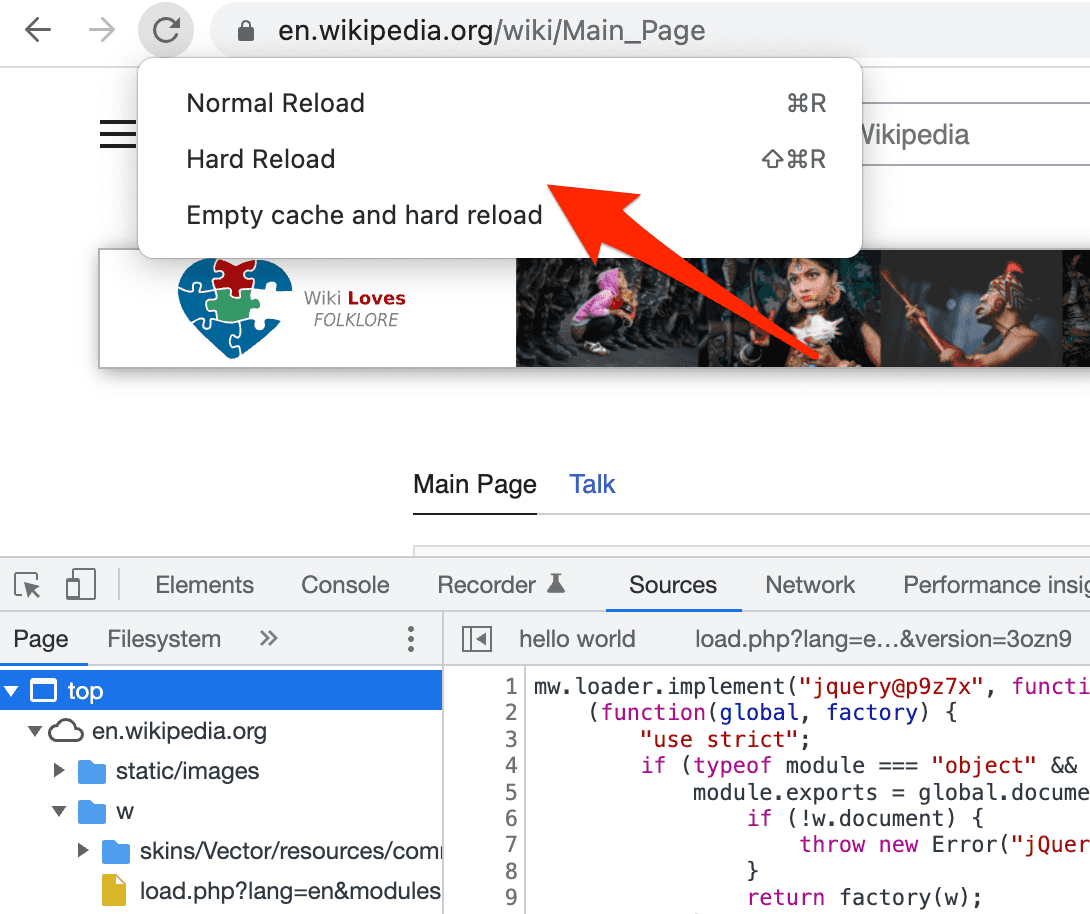
Normal reload will use cache as normal, hard reload will force the browser to reload the page with a fresh request (but subsequent requests might use cached version). Empty cache and hard reload will clear the cache so every request is fresh
Show the user agent shadow DOM
Some elements such as text inputs have their own user-agent specific shadow DOM. Normally these are hidden in the inspector, but you can show them.
- Go into the insepctor
- Click the settings button
- Search for
Show user agent shadow DOMand enable it
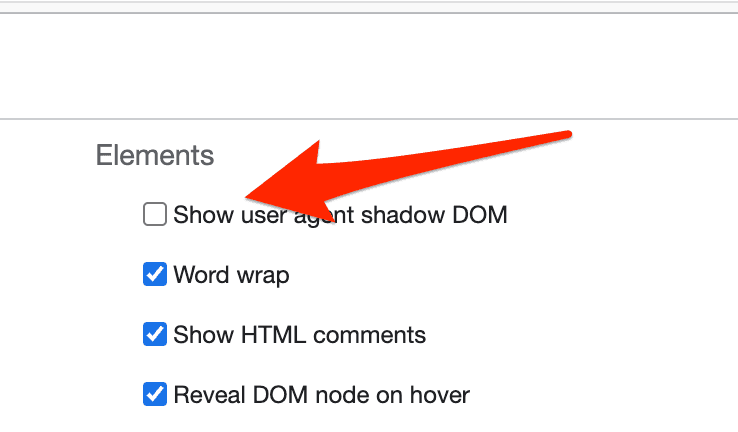
Then when you view elements with a user agent shadow dom (like most form elements) you can inspect it and see how it is built up.
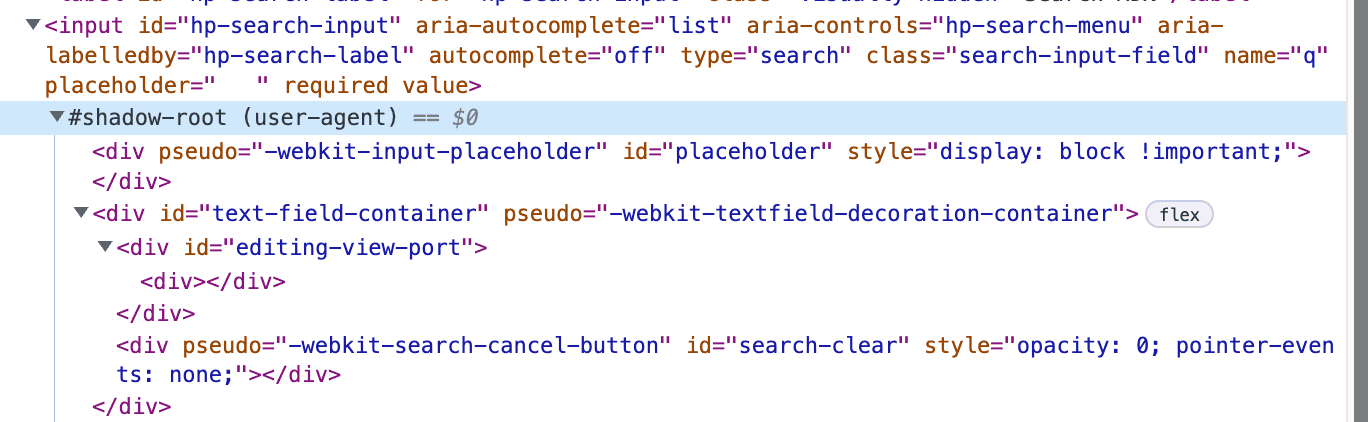
This is useful if you want to understand how native elements are styled or set up in the browser.
Use the 'open file' dialog
Press cmd + P on mac/ctrl + p windows to quickly open different source files (such as index.js, index.css).
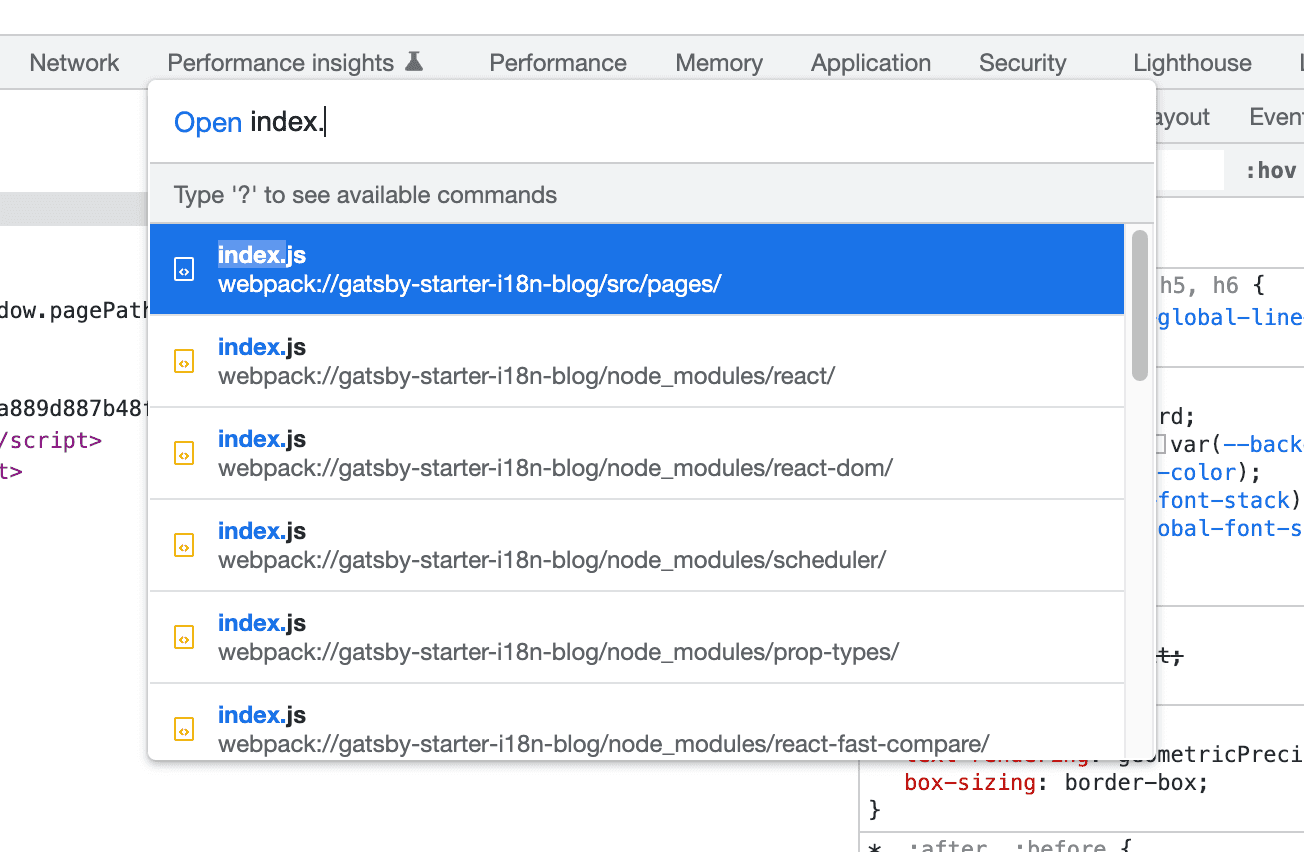
It is much faster than clicking through the sources panel to find a specific file.
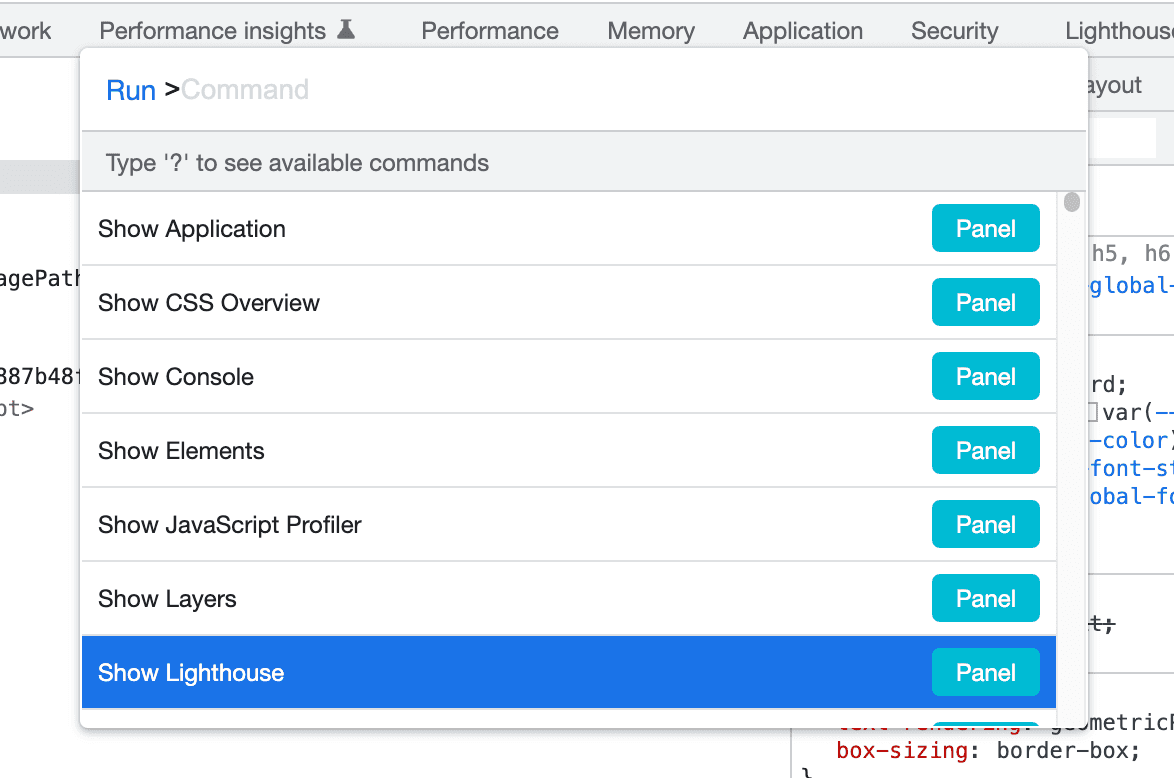
You can also press cmd + shift + p (ctrl + shift + p) to open the commands panel, to quickly run commands:
Use the 'flex' buttons in Chrome's inspector to dive into your flexbox rules
If you open up the Chrome inspector (cmd+option+i on Mac OS) and use the Elements tag, you should see a 'flex' button on any elements that uses flexbox:
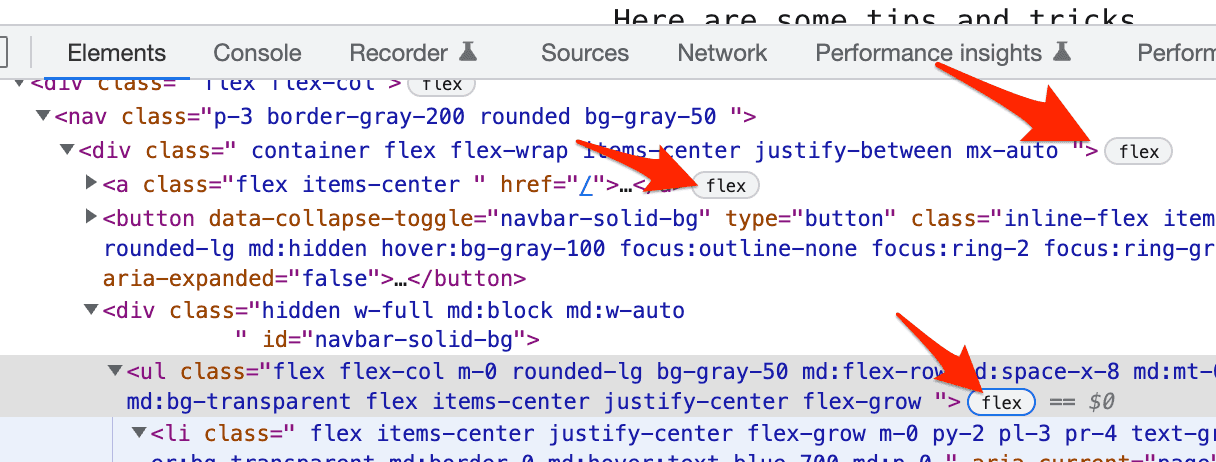
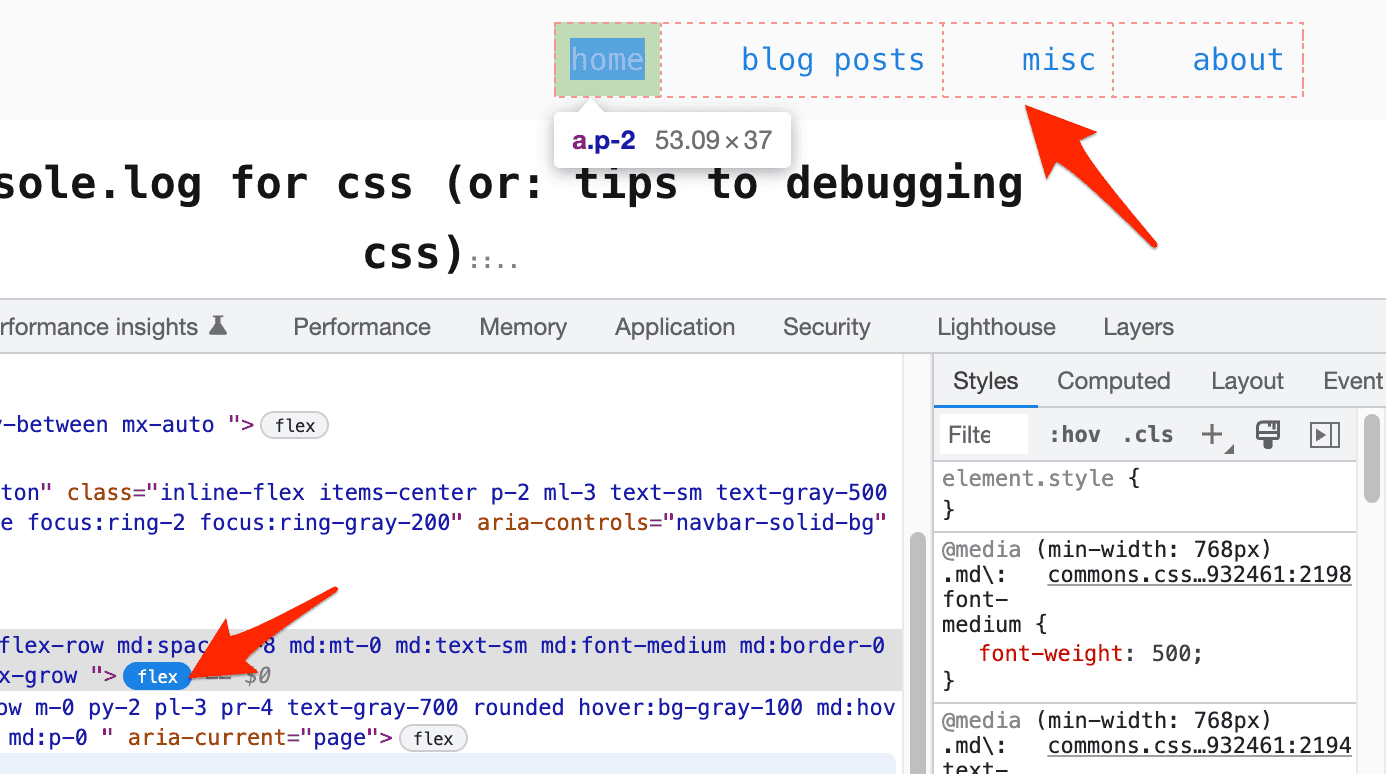
If you click one of them, you can see outlines of each flex 'column':
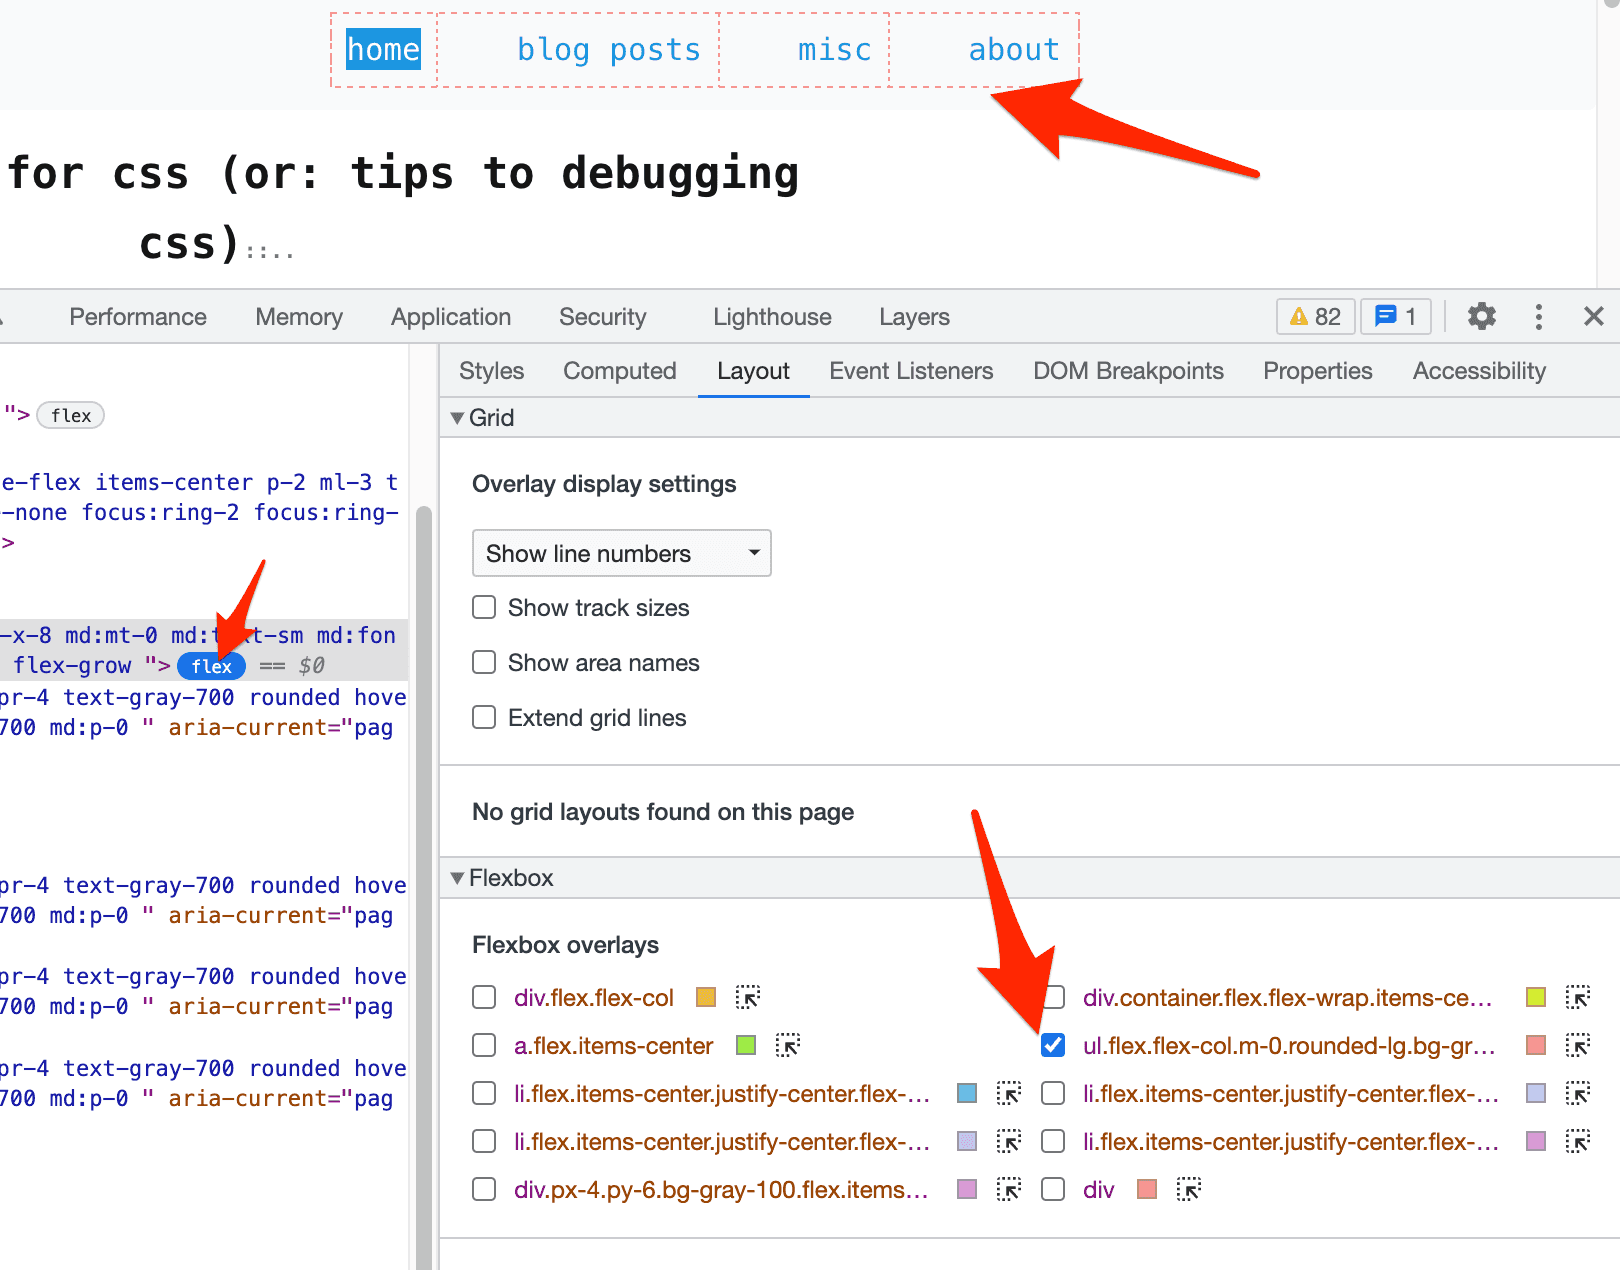
You can also see all available flex overlays, by going to the 'layout' tab in the sidebar (within the 'elements' tab):
And use the similar 'grid' buttons to see much more about your grid layouts
A more useful version is the grid overlays. It can sometimes be a bit annoying figuring out (counting) what column/row you want to place an element at. The grid overlay easily tells you.
It works in a similar way to the flex overlays - buttons in the DOM tree, and you can go to the "layouts" tab in the sidebar
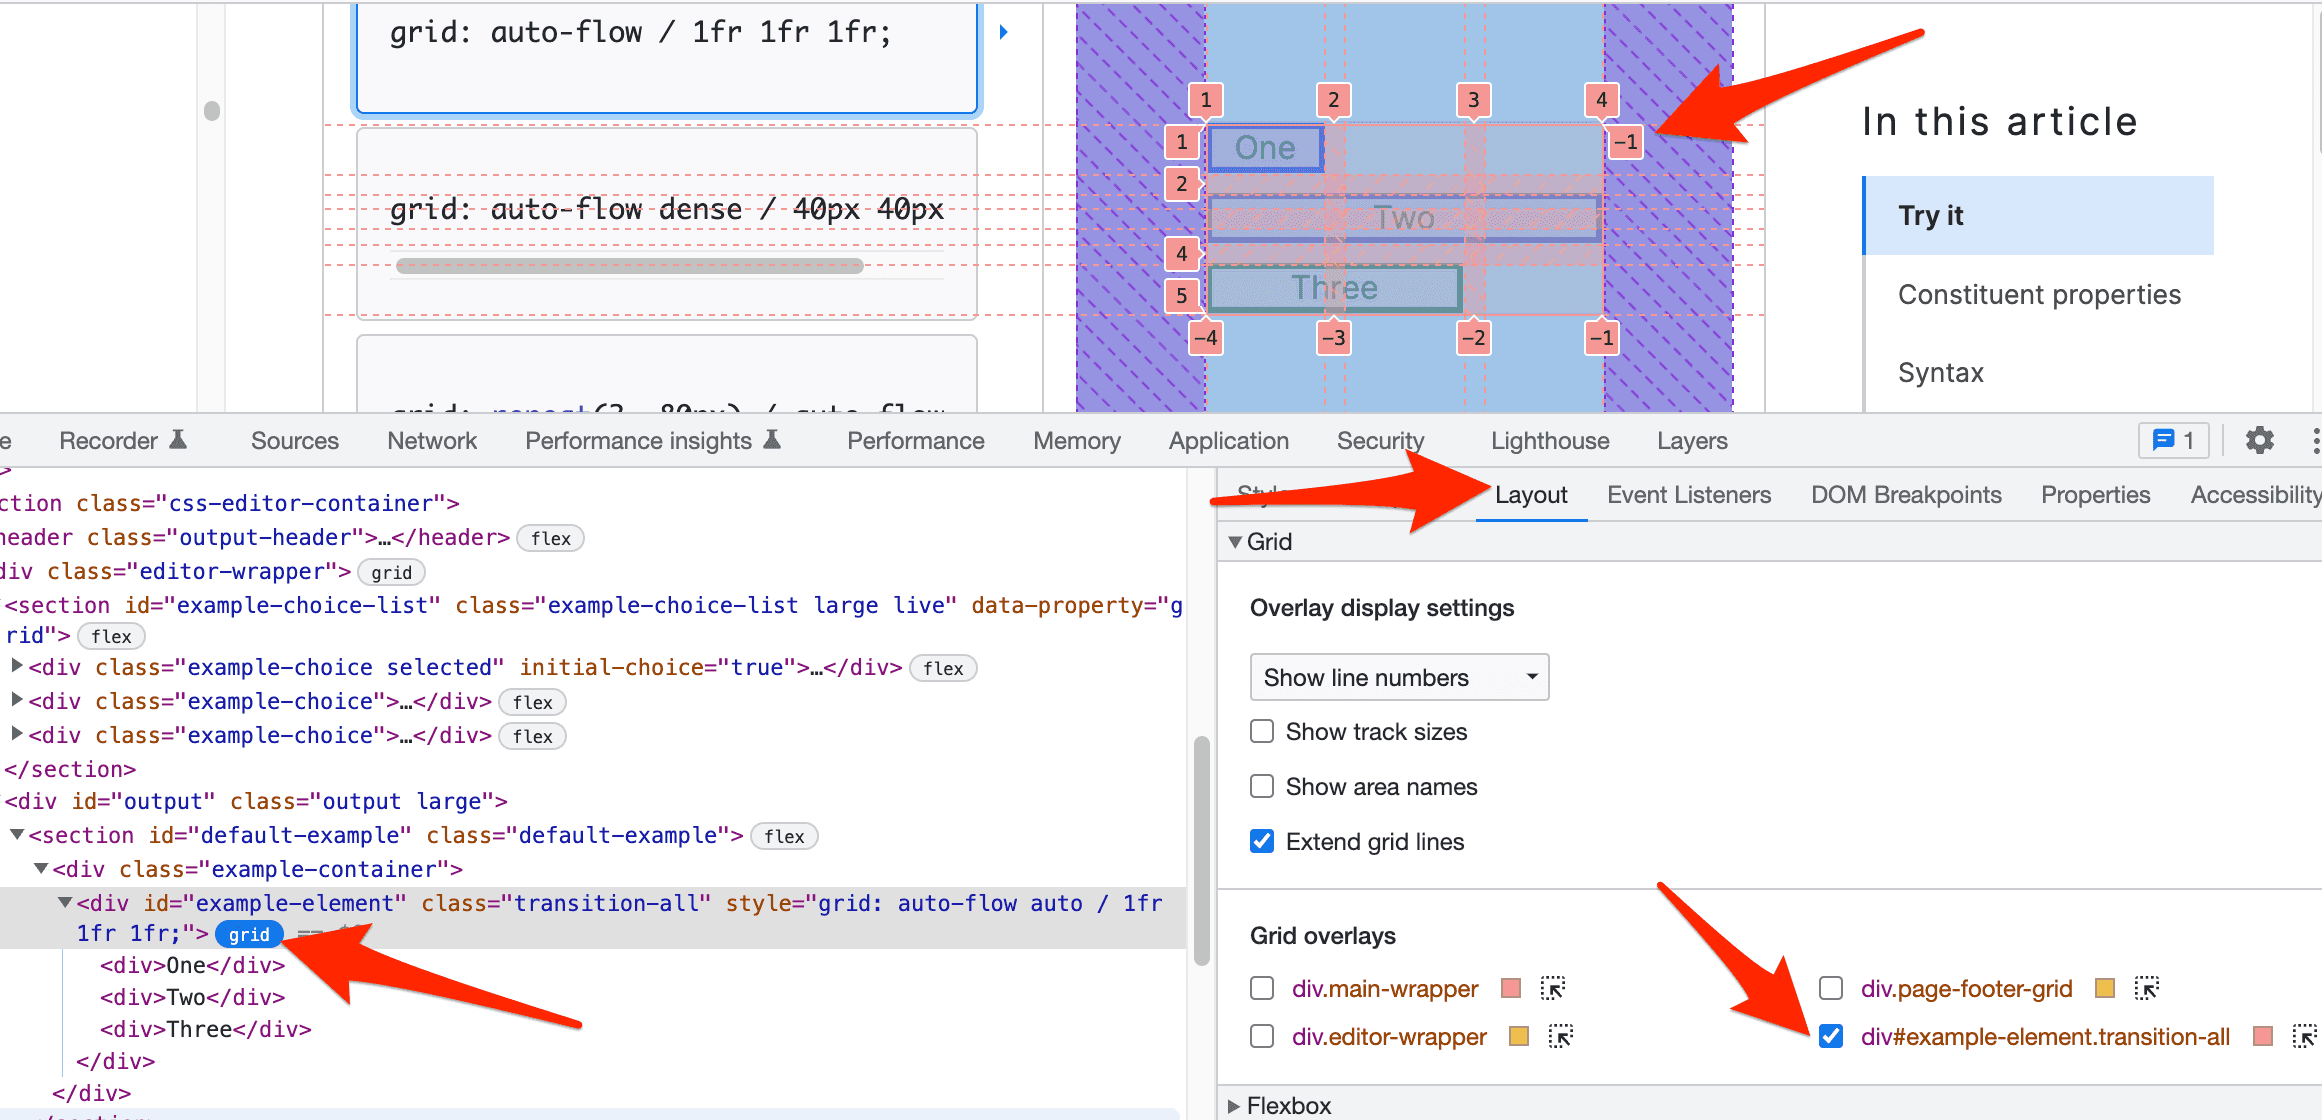
(click the image to see full size - or just find a page that uses grid and try it out in Chrome)
Currently selected element in the inspector is available in JS as window.$0
If you have ever noticed the $0 next to the currently selected element, you may have wondered what it is...
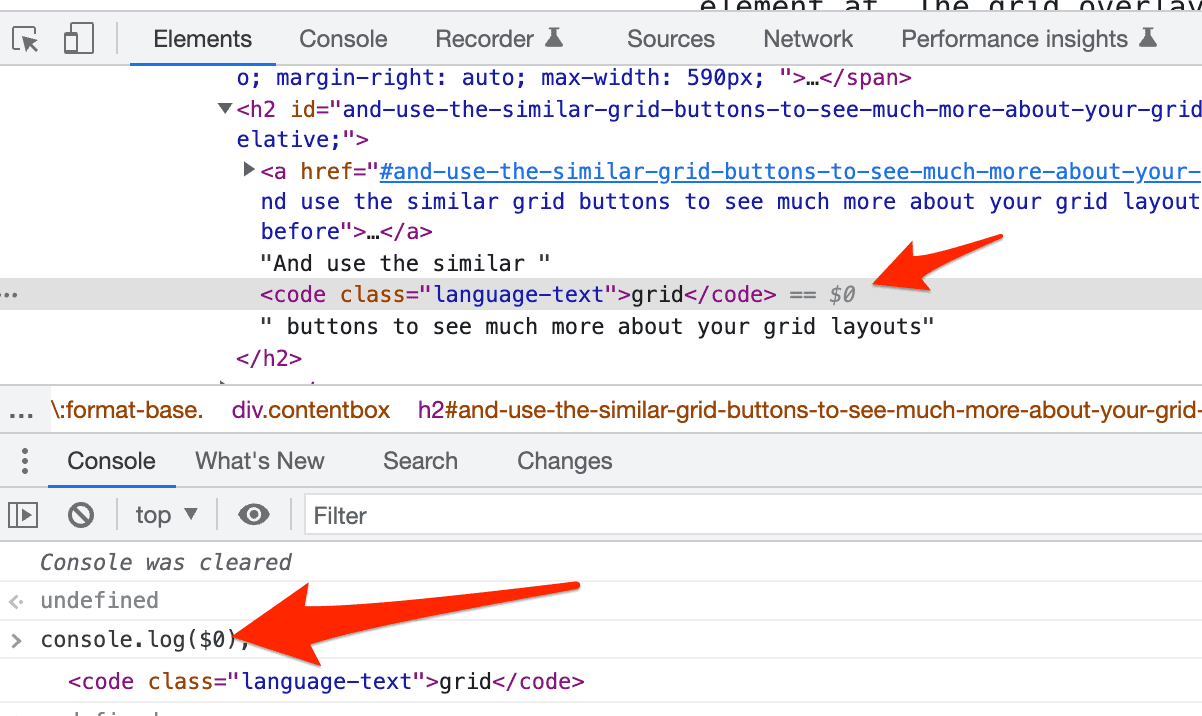
You can access that DOM element with window.$0 (or just $0) in your console.
You can do things such as $0.classList.add('some-new-class'), $0.parentElement, $0.click(), or $0.addEventListener('click', () => alert("clicked me")) etc.
You can also get the previously selected elements with $1, $2, $3, $4. I didn't realise this until today when I just tried it out.
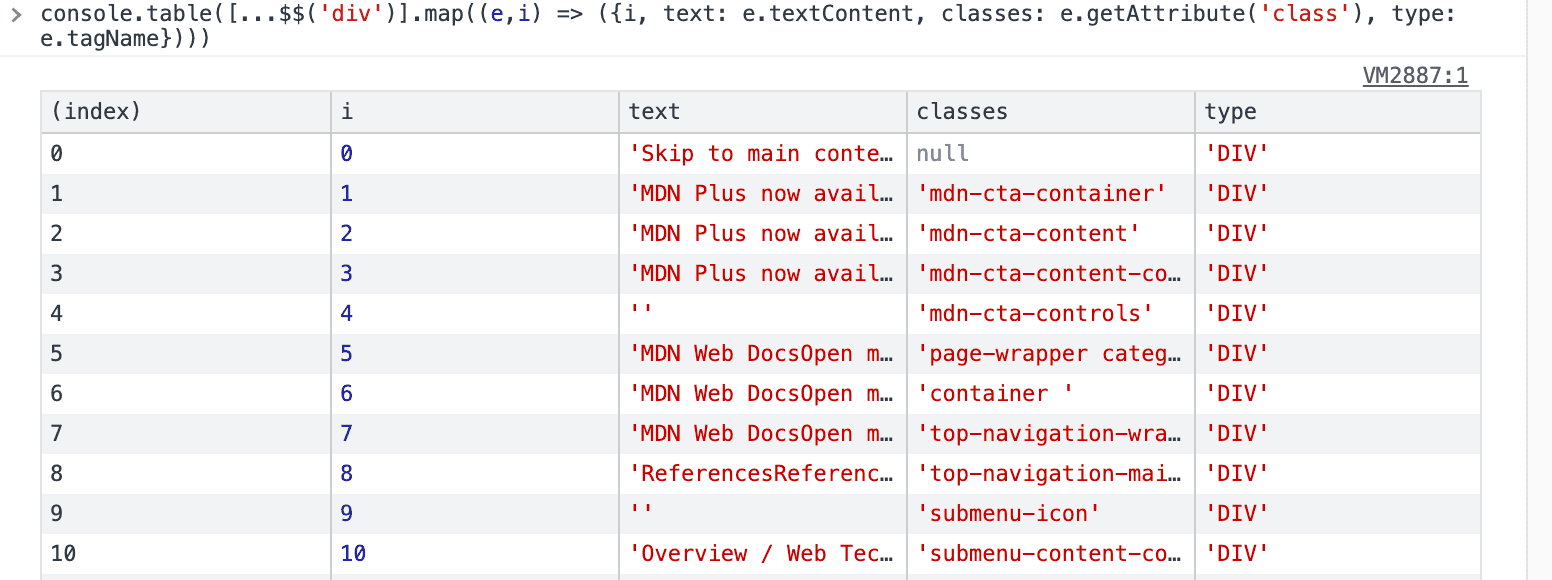
Use $ and $$ as aliases for document.querySelector() and document.querySelectorAll()
Try it in your console - do something like $('h2') to get the first h2 heading, or $$('h2') to get all h2 headings.
Other aliases - $_ and $x
There is also $_ which can be used to get the value of the last evaluated expression in the Console.
And $x to return an array of DOM elements that match a XPath expression.
e.g. $x("//p") to get all <p> elements
Copy values/ objects to clipboard (as a string)
If you have a value in the console, and you want to copy it (as text, to paste somewhere else) just pass it into copy()
const allHeadings = [...document.querySelectorAll('h1, h2, h3')].map(el => el.textContent)

copy(allHeadings)

/* if you cmd+v , you will paste in this as text:
[
    "Chrome inspector tips and tricks",
    // ... truncated
    "Force element states"
]

 */
Or copy things such as calculations:
copy(4 + 4) // 8 is now in your clipboard
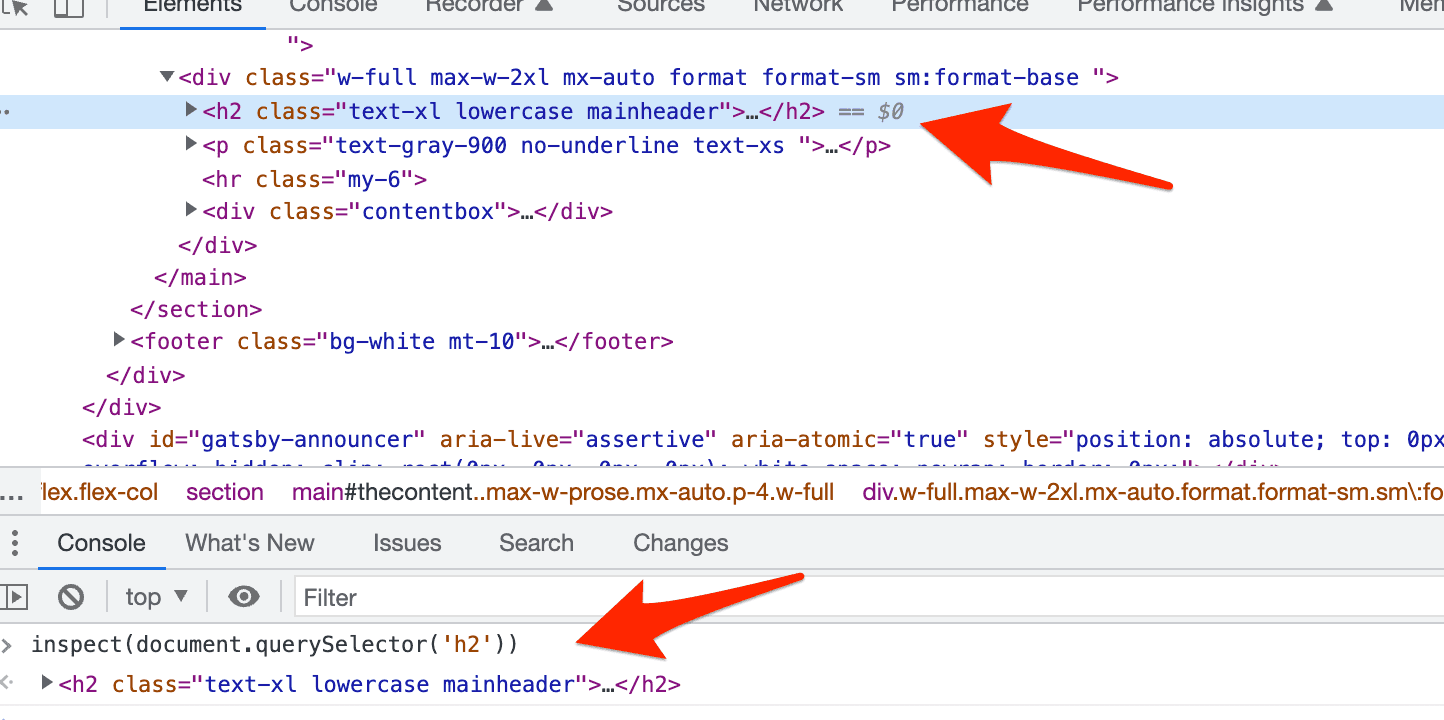
Open an element in the inspector
If you have a value in the console, and its an element in the DOM you can open the inspector to that item with inspect.
e.g.
inspect(document.querySelector('h1'))
And then your inspector view will appear with the first H1 tag selected.
Use the 'select an element' button (cmd + shift + C)
This is another commonly used one, but maybe someone has missed it.
There is a button on the bottom left to 'select an element'. Use it to select + see more information about an element.
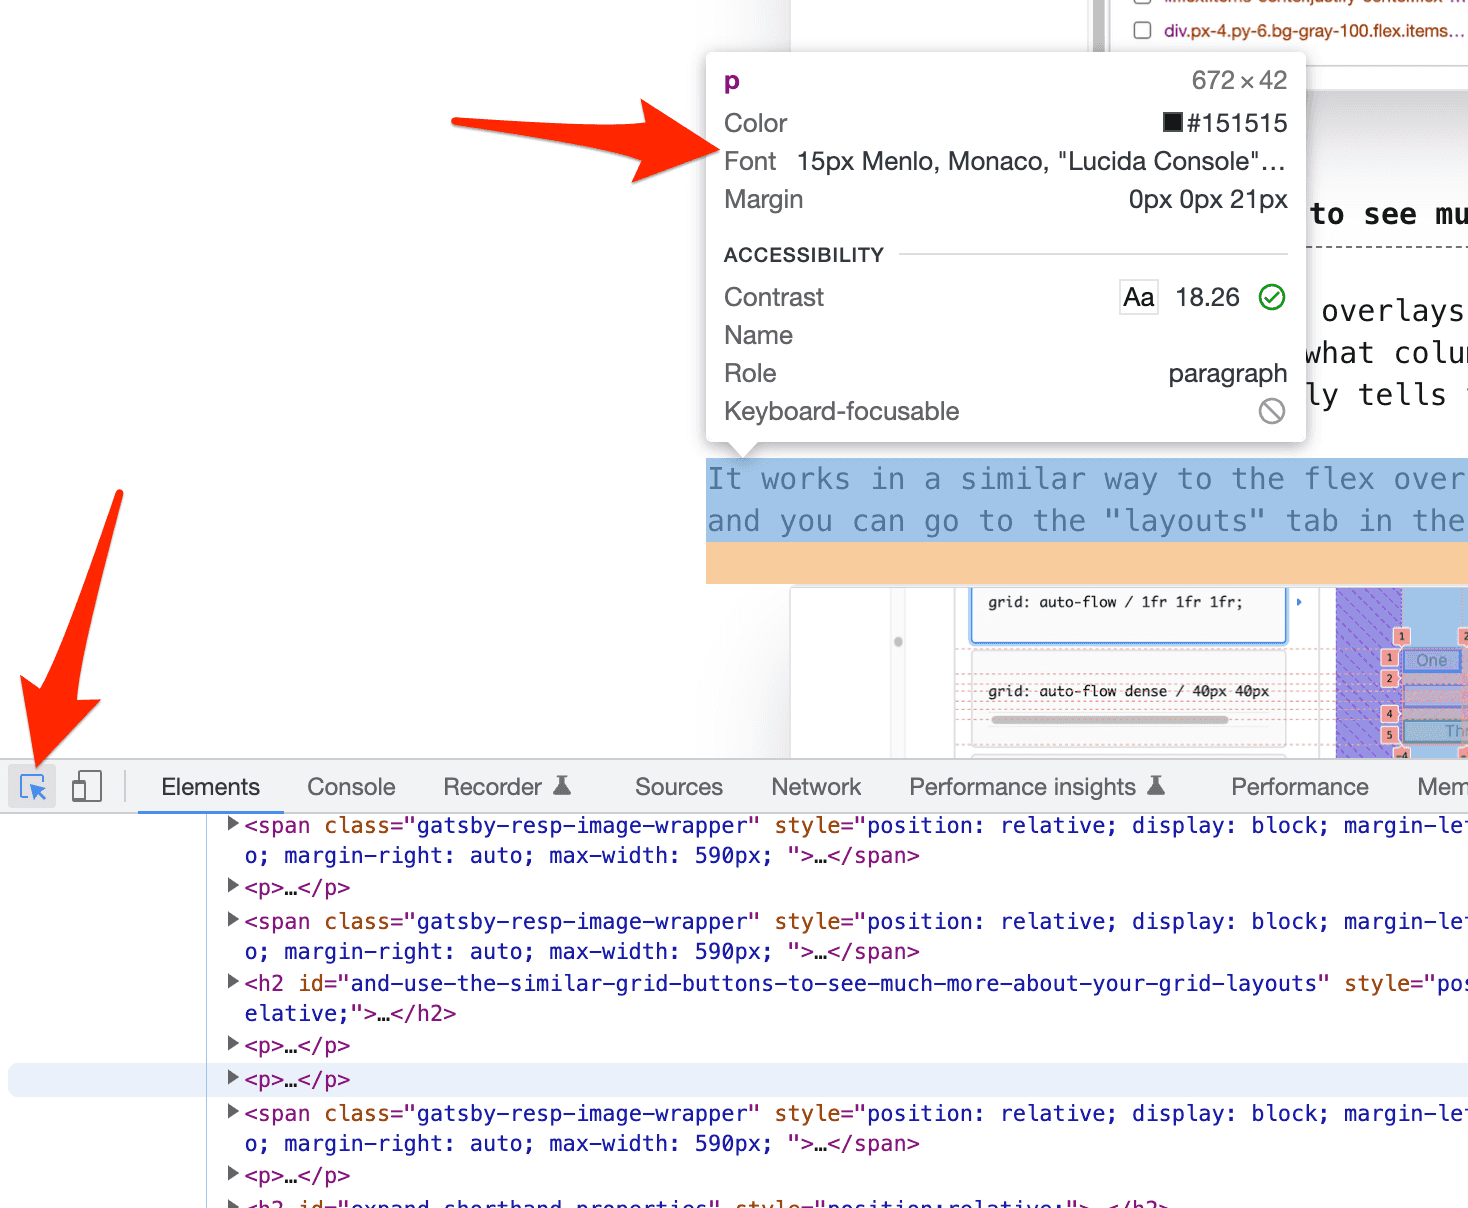
Once selected you can use the $0 trick from the previous tip to access it in the console.
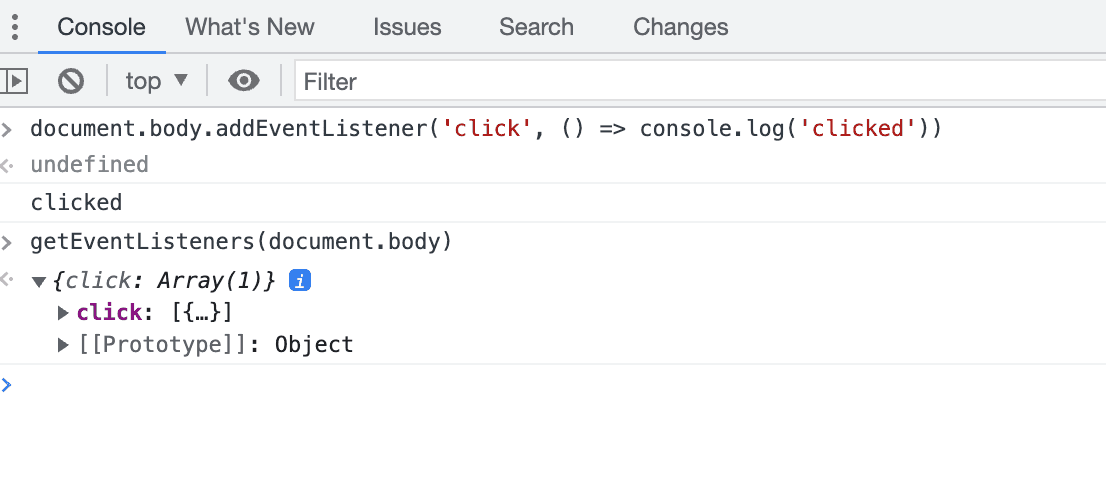
Get all event listeners for an element
Use getEventListeners() and pass in an element to get a list of all event listeners (grouped by type, e.g. click, etc):
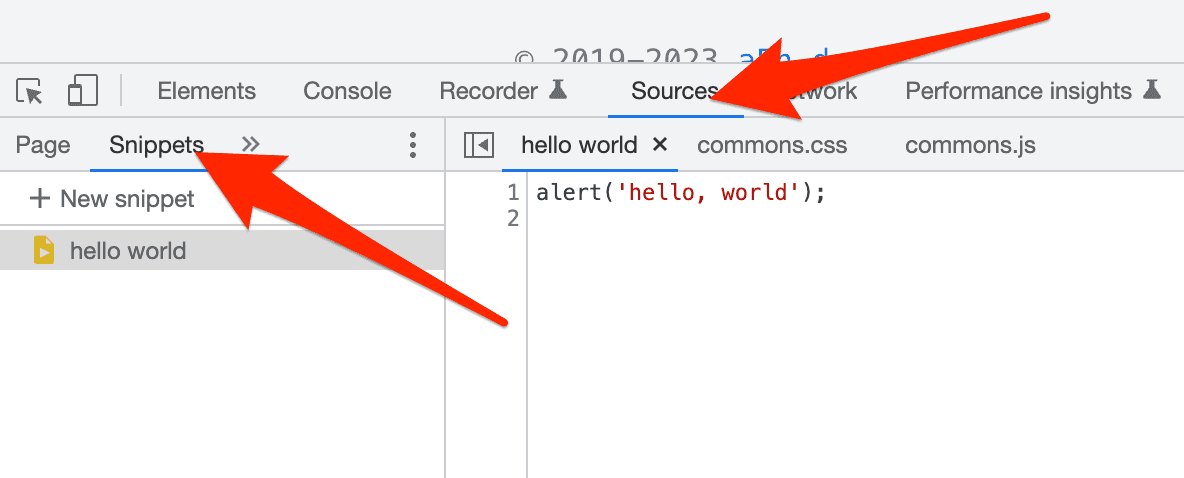
Snippets
If you often copy/paste the same code, you might find the snippets feature useful.
In the inspector, go to the sources tab, then in the left panel change the sidebar tab to snippets.
You can save them (locally) with cmd + s, and they are saved, always available.
You can press cmd + enter to run them.
They can be useful if you have to run some fetch() calls, its a bit easier to edit the code than doing it directly in the console.
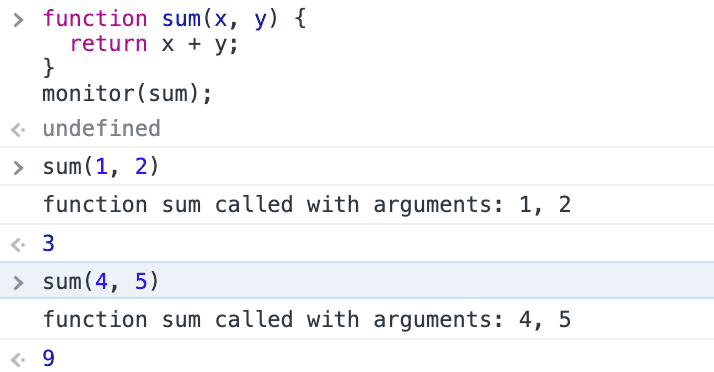
Use monitor() to log when a function is called
Call monitor(somFn) and you will get a log every time that function is called (such as function sum called with arguments: 1, 2)